
Overview: This guide explains how a catalytic converter lot moves from sample to settlement – how to read an assay report, convert grams per tonne into payable metal grams, apply refining returns and deductions, and reach a final scrap price. Because every figure depends on the sample, it also covers the representative sampling and homogenization steps that keep the assay honest, with worked examples, a settlement table, and a sampling playbook you can audit.
Key takeaways
- An assay report lists platinum (Pt), palladium (Pd), and rhodium (Rh) in grams per tonne (g/t), where g/t equals ppm; always convert wet weight to dry weight before calculating value.
- Payable metal = assay (g/t) x dry tonnes x the per-metal return percentage, and final settlement then subtracts treatment, refining, and sampling charges.
- Settle on a lab assay (ICP) of homogenized material, not a handheld XRF reading, which is a screening tool only.
- Rhodium content can swing the final number even when palladium dominates the grams, because value and returns differ per metal.
- Representative sampling is the single biggest factor behind a fair assay: sort, mill, mix, build multi-increment composites, and control moisture.
- Clean packaging, labeling, and a retained witness split protect your data and support chain-of-custody if a result is ever questioned.
Reading an assay report: what values matter
A catalytic converter assay report tells you how much precious metal is in your sampled catalytic converter load. It usually lists platinum (Pt), palladium (Pd), and rhodium (Rh) as concentrations. The most common units are grams per tonne (g/t) or parts per million (ppm). For our purposes, g/t and ppm are interchangeable. One g/t equals one ppm.
Look for these items on the report:
- Sample method and representativeness – Did the lab mill and blend the material? Was a proper split taken?
- Units and basis – Are results reported as g/t, ppm, or percent? Are they dry-basis figures?
- Moisture percentage – Wet weight must be adjusted to dry weight before calculating values.
- Element results – Pt, Pd, and Rh in g/t or ppm.
- Assay uncertainty – Sometimes listed as +/- values or a relative error range.
Handheld XRF is often used for screening, but a full catalytic converter assay analysis for settlement usually relies on a refined, lab-grade reading of homogenized material for accuracy. XRF readings can vary with preparation and matrix effects, which is why a precise catalytic converter assay depends on proper sampling and milling for final settlement figures. For a peer-reviewed example of how PGM content in spent converters is measured by XRF and ICP-OES, see this open-access study on recovering PGMs from spent catalytic converters.
Converting grams per tonne to payable metal grams
Here’s the step-by-step way to go from assay to metal grams you can get paid on.
- Determine dry weight. If you shipped 1,000 kg wet and moisture is 5%, the dry weight is 950 kg. Convert to tonnes: 950 kg = 0.95 t.
- Convert assay values to grams. The formula is simple: grams of metal = assay (g/t) x dry tonnes
- Apply refining returns (sometimes called recoveries). Different metals have different payable percentages based on process efficiency and contract terms.
- Sum the payable grams across Pt, Pd, and Rh. These payable grams are the basis for your final settlement before fees.
If your report lists Pd at 1,800 g/t, and your dry weight is 0.95 t, your gross Pd grams equal 1,710 g (1,800 x 0.95). Repeat for Pt and Rh.
Deductions, refining returns, and settlement formulas
After calculating gross grams from the assay, the refiner applies a settlement formula. The main moving parts are:
- Payable metal percentages – Often expressed as a percentage per metal. Pd and Pt are typically high. Rh recovery can be slightly lower because of its chemistry and process specifics.
- Treatment and refining charges – Fixed or per-unit fees for processing, analysis, and hedging.
- Sampling and assay charges – Fees for milling, splitting, and lab work.
- Moisture and loss – Moisture is removed up front; process loss may be embedded in the payable percentages.
- Forwards or hedge – If you hedge metal during the process, the contract may reflect that.
Final payment is a function of sample representativeness, accurate assay, agreed recoveries, and contract charges. Those grams carry real weight because recycled platinum, palladium, and rhodium now supply a significant share of world demand, as the USGS overview of platinum-group elements explains.
A table to keep things straight
| Settlement Component | What It Means | How It’s Applied | Tip |
|---|---|---|---|
| Dry weight | Wet weight minus moisture | Wet kg x (1 – moisture%) | Verify lab moisture vs. your receiving weight |
| Assay concentration | Pt/Pd/Rh content in g/t | g/t x dry tonnes = grams | Confirm units; ppm = g/t |
| Payable metal | Recovered grams after returns | Metal grams x return % | Each metal may have a different % |
| Treatment/refining | Processing and lab costs | Fixed or per-unit deductions | Ask for a line-item schedule |
| Final settlement | Payable grams less fees | Per contract formula | Reconcile with a spreadsheet check |
Example calculations showing catalytic converter price outcomes
Let’s run two simple scenarios using round numbers. These are for illustration, not a quote.
Scenario A: Mid-grade mixed lot
Assume:
- Wet weight: 1,000 kg
- Moisture: 5% – so dry weight is 950 kg, or 0.95 t
- Assay: Pt 500 g/t, Pd 1,800 g/t, Rh 300 g/t
- Returns (hypothetical): Pt 98%, Pd 98%, Rh 95%
Gross grams:
- Pt: 500 x 0.95 = 475 g
- Pd: 1,800 x 0.95 = 1,710 g
- Rh: 300 x 0.95 = 285 g
Payable grams after returns:
- Pt: 475 x 0.98 = 465.5 g
- Pd: 1,710 x 0.98 = 1,675.8 g
- Rh: 285 x 0.95 = 270.75 g
From here, a settlement would apply the contract’s deductions. Your spreadsheet should reconcile from assay to payable grams and then to final payout.
Scenario B: Higher-rhodium load
Assume:
- Wet weight: 600 kg
- Moisture: 3% – dry weight is 582 kg, or 0.582 t
- Assay: Pt 350 g/t, Pd 1,200 g/t, Rh 600 g/t
- Returns (hypothetical): Pt 98%, Pd 98%, Rh 94%
Gross grams:
- Pt: 350 x 0.582 = 203.7 g
- Pd: 1,200 x 0.582 = 698.4 g
- Rh: 600 x 0.582 = 349.2 g
Payable grams after returns:
- Pt: 203.7 x 0.98 = 199.6 g
- Pd: 698.4 x 0.98 = 684.4 g
- Rh: 349.2 x 0.94 = 328.2 g
Notice how the higher Rh content changes the metal distribution and your exposure to that metal’s return percentage. This is why accurate blending and sampling matter so much.
Common misunderstandings and reconciliation tips
Misunderstanding 1: Confusing wet and dry weight. Always use dry tonnes when converting g/t to grams. Moisture can swing results more than any single fee.
Misunderstanding 2: Mixing units. If the lab uses ppm, remember it equals g/t. If you see percent, convert to g/t before calculating grams.
Misunderstanding 3: Assuming 100% recovery. Payable metal reflects process efficiency, not theory. If your return rates look low, ask for a technical explanation and any assay cross-checks.
Misunderstanding 4: Comparing apples to oranges. Two quotes can look different if one includes sampling and refining charges in the payable percentages and the other lists them as separate deductions.
Misunderstanding 5: Over-relying on spot checks. Field XRF can be helpful for sorting, but settlement should be based on a representative sample of milled material and a documented chain of custody. The science behind this is the Theory of Sampling, summarized in this overview of sampling errors and representativeness.
Recohub’s transparent settlement examples
Transparency starts with sharing the math. Whether you’re a small yard or an experienced catalytic converter recycler, the catalytic converter assay process and the path from assay to payment should read the same every time: dry weight, g/t to grams, returns, deductions, and final payout. We encourage customers to mirror our worksheet in their own spreadsheet, so their totals match line by line.
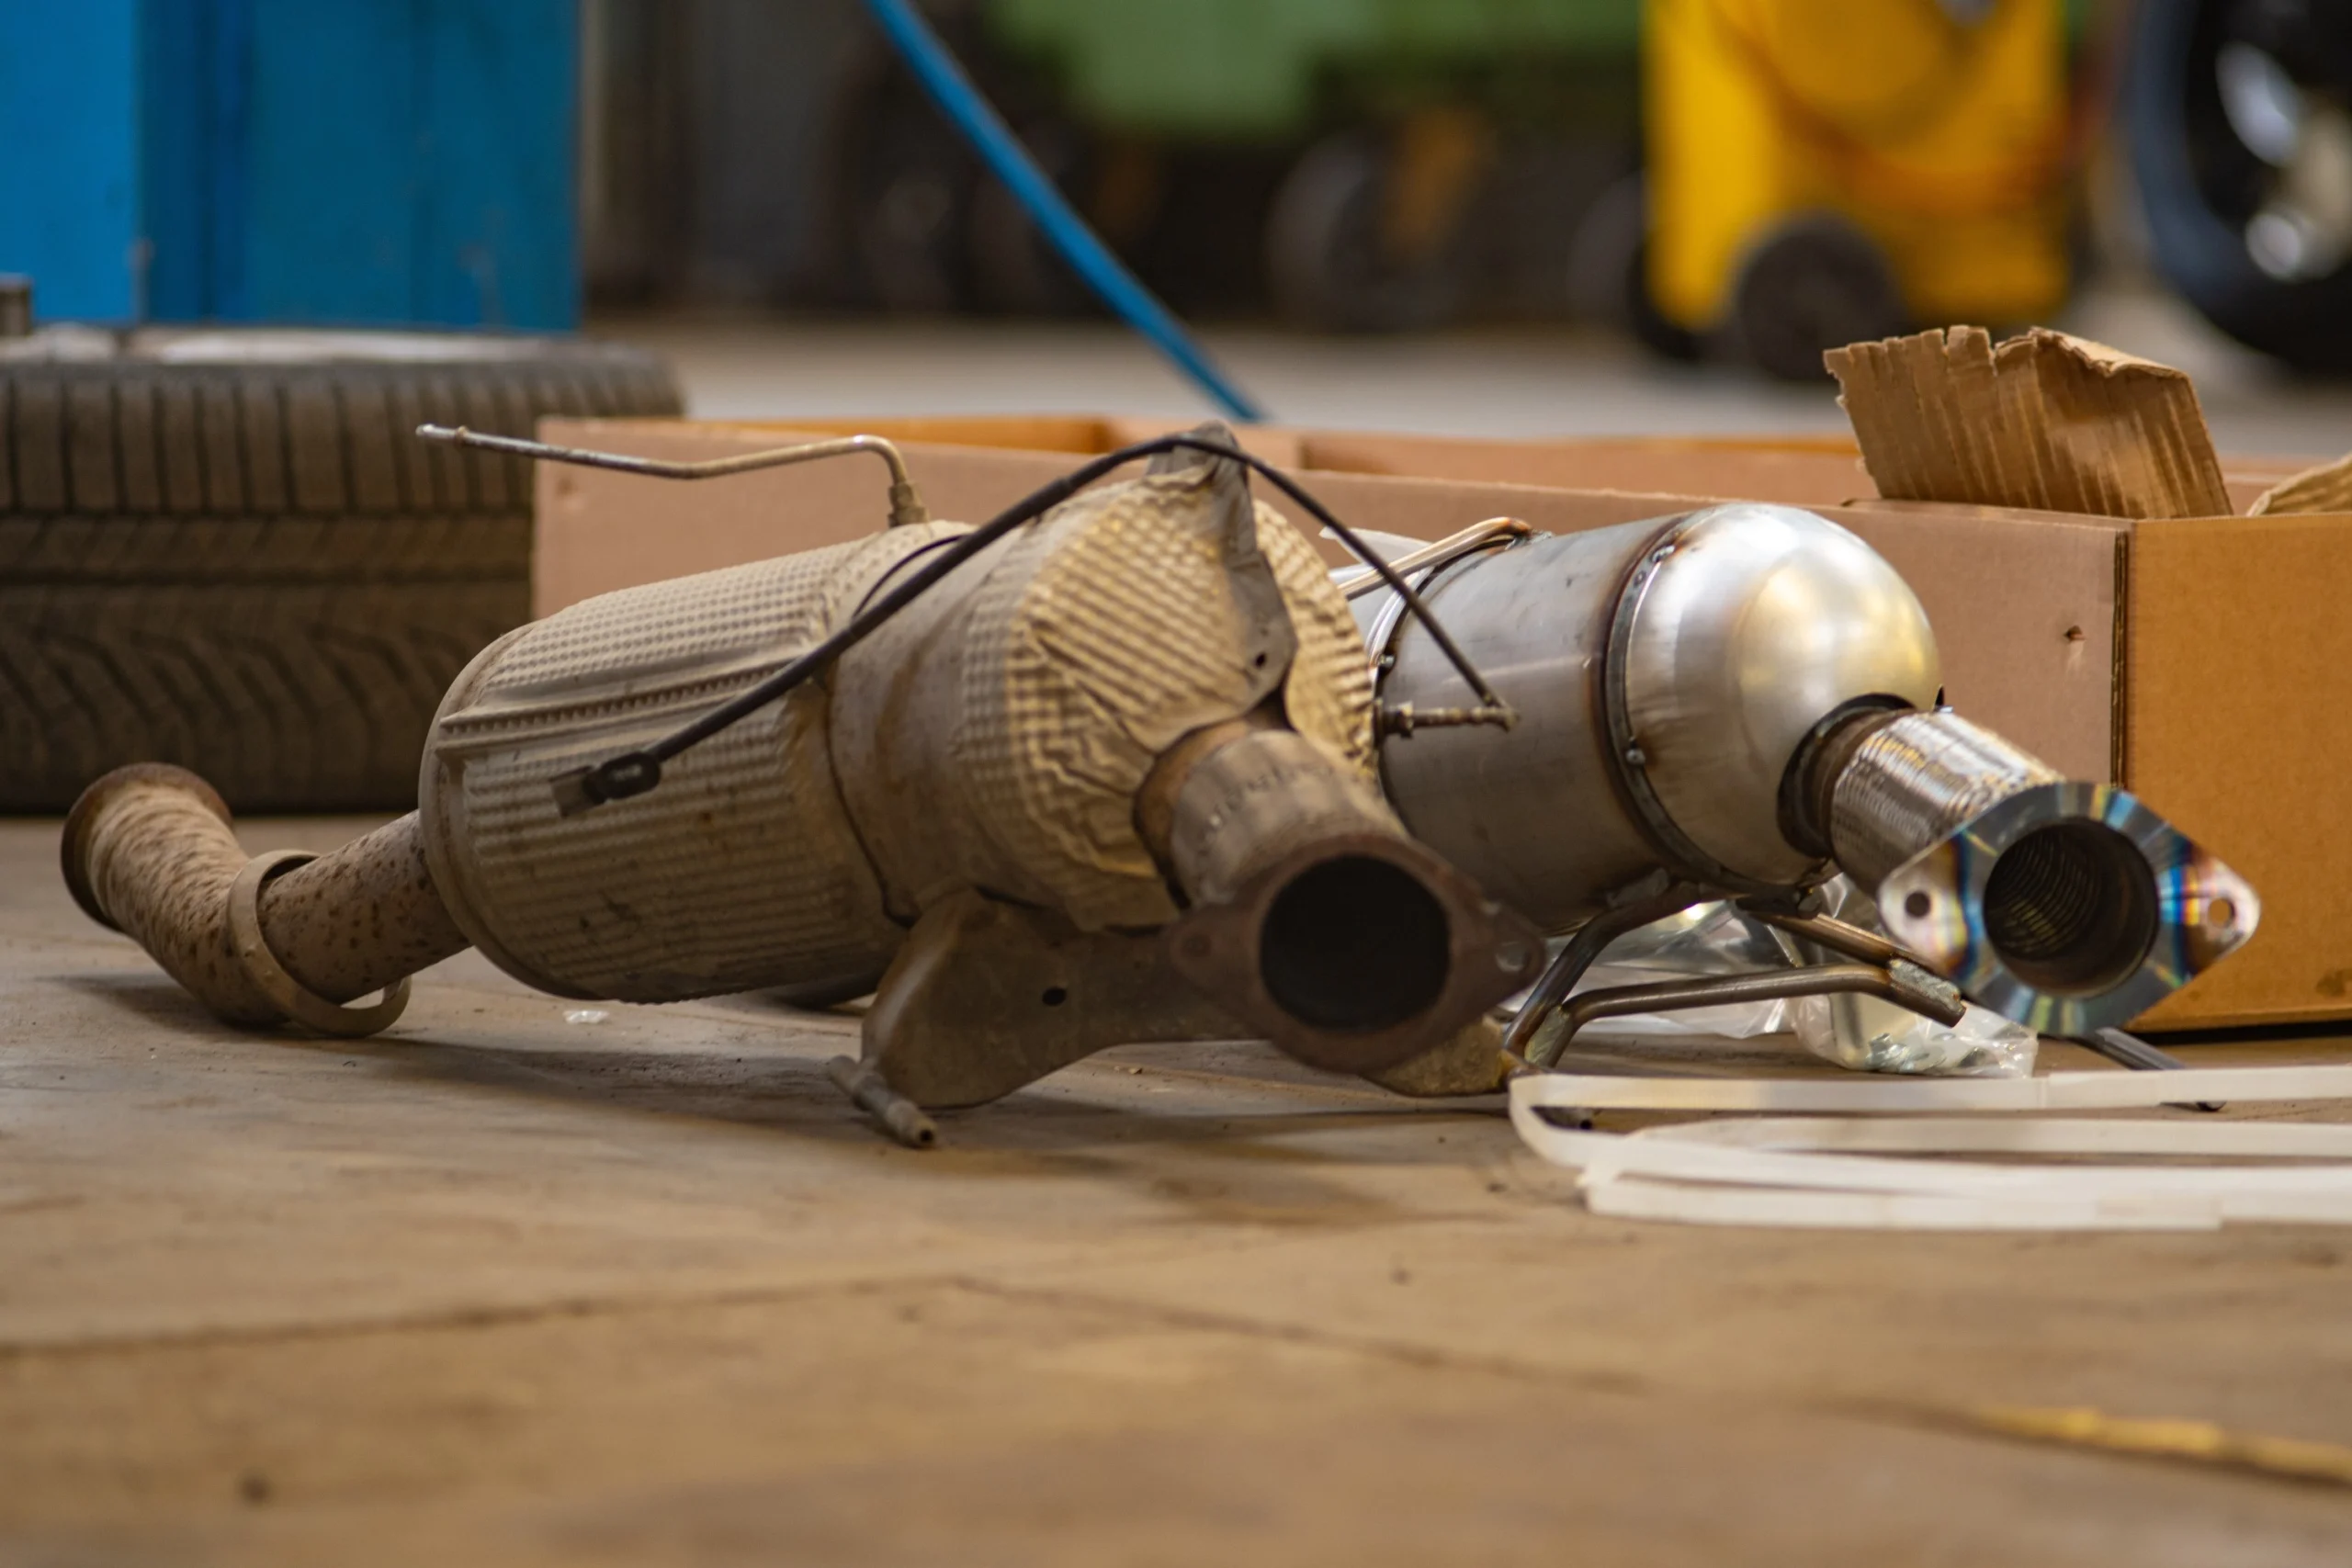
If you’re evaluating programs, compare service approaches too. Our page on DPF vs catalytic converter differences and recycling explains how different emissions components affect metal content and processing. And because end uses help set long-term demand for reclaimed metals, see how recovered Pt, Pd, and Rh can support new products in how recycled catalytic converters fuel jewelry.
For readers focused on environmental impact as well as returns, this explainer on catalytic converters and the fight against smog gives additional context you can share with your team and customers.
How to request an independent review
Third-party assurance can build trust. You can ask for a split sample at the time of milling and have it sealed for an independent assay. If the independent result falls within the contract’s variance tolerance, final settlement stands. If not, the contract may specify a referee lab or a calculated average. The key is to request the split before the sample leaves your facility and to record weights, seals, and signatures at each step.
Also consider staged hedging if your material will be in process for a while. While the lab work happens, your agreement can define how and when metal is locked. Keep the timeline and hedge events documented alongside your assay and settlement worksheets.
Step-by-step worksheet you can follow
- Record receiving wet weight and moisture to get dry kg and tonnes.
- Pull assay values for Pt, Pd, Rh in g/t (or convert ppm to g/t).
- Multiply each metal’s g/t by dry tonnes to get gross grams.
- Apply the contract returns per metal to get payable grams.
- List treatment, refining, sampling, and any hedge or handling fees.
- Reconcile final figures against the settlement notice.
- File the lab certificate, weight tickets, and milling logs together.
Why sampling matters more than anything else
All the math is only as good as the sample. A well-milled, fully homogenized sample dramatically reduces variation between labs and runs. If results swing widely across samples, investigate the preparation and splitting steps before assuming a lab error. Ask for photos or logs showing how the material was crushed, blended, and divided.
Representative sampling is the single biggest factor behind fair assays and payouts on converter lots. Every batch of converters varies – models, mileage, engine type, and prior handling all swing the precious metals distribution, so a small, biased grab can miss that variation. The sections below show how to homogenize a lot and pull a sample the lab can trust. For context on the scale of catalytic-converter recycling and why representative material matters, see the USGS Mineral Commodity Summaries for platinum-group metals.
Sampling methods that keep assays representative
Pre-sort by type and state
Group by substrate (ceramic vs metal foil), OEM vs aftermarket, and visibly damaged vs intact. Keep DPFs separate from three-way converters. Sorting reduces within-group variance and improves the representativeness of sample increments.
Decan, mill, and mix thoroughly
After safe decanning, mill ceramic to a consistent size. A target where the majority passes a fine screen helps the mix behave like a uniform material. Use a clean mixer to blend for several minutes, scraping sides to avoid pockets of coarse or fine material. Pull increments across the entire stream or drum at timed intervals rather than from one spot.
Use multi-increment composites
Build one composite sample per sorted group from many small increments. More small bites beat one large scoop. Label each composite with batch ID, item count, and mass.
Control moisture
Moisture changes weight and element readings. Air-dry or use controlled low-heat drying before final mixing and sampling. Record moisture loss on a small parallel split to correct assays if needed.
Screen with XRF, settle on a lab assay
For screening, handheld XRF can guide you, but final values should rely on lab-grade methods like ICP after proper digestion. Reputable lab protocols detail milling, homogenization, duplicate splits, and calibration standards to avoid bias. For a peer-reviewed review of the processing and analytical routes behind PGM recovery from spent catalysts, see this open-access review of green PGM recovery from spent auto-catalysts.

Packaging and labeling to avoid contamination
Cleanliness protects your data. Use new, sealable bags or sterile sample jars. Avoid recycled sacks that shed dust from prior jobs. Wear nitrile gloves, swap them between batches, and clean any scoops or funnels before use.
On each container, write a unique ID, batch description, material type, gross weight, and sampling date. Put the same data on a waterproof card inside the outer bag in case the label smudges. Create two splits: a lab sample and a retained reference. Seal both. Photograph every bag with the label visible to maintain a simple chain-of-custody record.
How sampling errors move the catalytic converter price
Assay drives settlement, so a skewed sample shows up later as a mismatch between expectation and payout. Watch for three common pitfalls:
- Grab-only sampling from the top of a drum misses fines that often concentrate PGM dust, which undercuts the catalytic converter scrap price you expect to see modeled in the assay.
- Wet material weighs more but can read lower until moisture correction is applied, which clouds comparisons across batches.
- Large chunks that dodge milling can hide undigested PGM, reducing measured values at the lab stage.
The effect is not subtle. A few percent swing in measured PGM can change valuation tiers and payment structures, which is why modern programs insist on blended composites and duplicate testing. Because spent automotive catalysts are now a strategic PGM source, accurate measurement carries real value, as this review of PGM recovery from spent catalysts describes.
Homogenization playbook: a quick reference
| Sampling step | What it does | Common error | How to fix it |
|---|---|---|---|
| Sort by type | Reduces variability inside each group | Mixing DPFs with three-way cats | Separate and label groups clearly |
| Mill to uniform size | Improves blend and repeatable splits | Leaving coarse chunks in the mix | Screen and re-mill outliers |
| Timed multi-increment sampling | Builds a true composite | One scoop from the top layer | Pull small increments across time and location |
| Moisture control | Prevents weight and assay distortion | Bagging wet powder | Air-dry, record moisture loss on a split |
| Duplicate splits | Checks repeatability | No retained sample | Keep a sealed witness split |
Sampling acceptance criteria
Recyclers and labs usually look for simple, verifiable basics rather than rigid thresholds. Typical acceptance points include:
- Clearly labeled composites with batch IDs and material type.
- Evidence of homogenization – decanned, milled, and mixed – before sampling.
- Chain-of-custody notes and clean containers that avoid cross-contamination.
- A retained witness split for verification if results are questioned.
- Agreement on analytical methods and any moisture adjustments in advance.
If you are new to this or scaling up, start by aligning your intake sort, milling, and compositing steps with the outline above. Then document it. A one-page SOP and photos of each batch at each step go a long way.

Schedule a sampling audit
Here is a simple path you can implement this week:
- Map your current flow – intake, sort, decan, mill, mix, sample, package.
- Pick two recent batches and run side-by-side composites with better mixing and timed increments. Compare results.
- Create a two-page SOP with photos. Train the team and assign a sampling lead.
- Set up duplicate splits and a moisture log. Keep them for 90 days or your chosen window.
- Invite a third-party review to walk your process and spot blind spots.
If your goal is a cleaner settlement variance and fewer disputes, a short audit pays for itself in saved time and tighter results.
Sustainability notes that touch your bottom line
Consistency and sustainability go hand in hand. Clean, well-sorted loads not only help the environment but also reduce contaminants that can cause processing loss. For ideas your team can share with customers about the bigger picture, you might find this piece on recycled catalytic converters and ocean pollution useful in outreach materials.
Where our services fit into your process
If you want a one-page refresher and hands-on support from intake to settlement, start with our service overview. It outlines how we handle sampling, assay coordination, returns, and documentation.
When you’re ready to recover value at scale, explore our program for catalytic converter recycling to see how we manage milling, representative sampling, and straightforward settlements.
If your operation also handles batteries, our team can streamline logistics. Learn how we accept, test, and safely process packs on the Hybrid Batteries Recycling page.
Troubleshooting: reconciling your sheet with the settlement
Here’s a quick checklist when your numbers don’t match:
- Check moisture. Are you converting from wet to dry correctly?
- Confirm units. Did you mix ppm and g/t or miss a decimal?
- Returns per metal. Are you using the exact contract percentages for Pt, Pd, and Rh?
- Fees and order. Did you subtract or add a fee in the wrong place?
- Timing. If a hedge or provisional occurred mid-process, account for it by date in your sheet.
- Sample identity. Ensure the lot number on the assay matches the settlement lot.
When you still can’t find the discrepancy, ask the lab or recycler to walk through each line with you. A five-minute call often solves a two-hour spreadsheet struggle.
What affects your catalytic converter scrap price the most?
Your metal distribution and returns matter most. Rh content can swing the final number even when Pd dominates the grams. Moisture control, clean sorting, and prompt processing also help. Transparent fee schedules make it easier to predict outcomes and reduce surprises on the settlement.
For auction sellers or dismantlers comparing quotes, focus less on a headline catalytic converter scrap price and more on the math behind it. If two offers start with the same assay but yield different payables, the difference lies in returns and charges, not the chemistry.
A quick glossary
- Assay – A lab analysis telling you how much Pt/Pd/Rh a sample contains.
- g/t (or ppm) – The concentration of metal per tonne of material.
- Payable metal – The grams paid after applying returns and deductions.
- Returns – The percentage of each metal credited based on process recovery.
- Settlement – The final statement calculating your payment.
Summary
Assay results become a clear settlement when you follow a simple path: convert the g/t figures to grams using dry tonnes, apply per-metal returns, then account for the listed charges. Keep your records tight, ask for split samples, and reconcile everything in a small worksheet. And remember that every figure traces back to the sample: sort, mill, mix, and composite well, and the assay will reflect reality. If you want a dependable partner for sampling and settlement support, our catalytic converter recycling team can guide you step by step.